Measuring and Problem Solving

Measuring and Problem Solving
The purpose of this is to give quick reference to information or to use in an emergency (like if your text has accidentally been left under your desk at school).
This is NOT intended to replace reading the text with its excellent photographs, diagrams, charts, and tables.
UNITS OF MEASURE
2.1 The Metric System The system of measurement that is best suited to scientific purposes is the metric system. Developed in France near the end of the eighteenth century, the metric system uses a decimal basis for multiples and subdivisions of the basic units of measure, which greatly simplifies calculations.
In 1866 Congress legalized the metric system for use in the United States, and since 1893 the yard and the pound have been defined in terms of metric measures. In 1975, a law was passed to promote more extensive use of the metric system in the United States, but no date for complete conversion was specified.
The modern metric system is officially called the International System of Units (abbreviated SI for System International d'Units). The International Bureau of Weights and Measures, which oversees the system, is located in Sevres, France, a suburb of Paris.
The property of the Bureau is internationally owned, much like the buildings and grounds of the United Nations in New York. In a system of measurement, it is important to distinguish between physical quantities and units of measure. A physical quantity is a measurable aspect of the universe, such as length. The metric unit of measure for length is the meter.
In 1996, Congress established that the Metric System is the Preferred System for the United States. Let's start preferring it!
There are seven Fundamental units of measure. These seven units, the physical quantities they measure, and the symbol for each are shown in Table 2-1. (Because this information is so important, it is also shown inside the front cover of the book and in Appendix B, Table 4.)
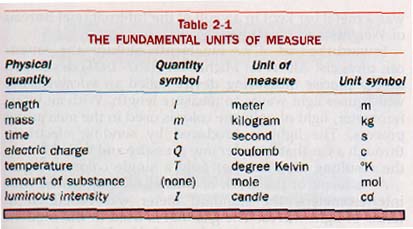
The meter, kilogram, and second are basic to the study of mechanics. The degree Kelvin and the mole are used in the study of heat. The candle is used in measurements of light. The coulomb will be used in the section of the course on electricity. Since the meter, kilogram, and second are three of the fundamental units, the modern metric system is sometimes also called the MKS system.
Physical quantities other than those in Table 2-1 are measured by using combinations of the fundamental units of measure. For example, velocity is measured in meters per second and mass density in kilograms per cubic meter (or grams per cubic centimeter). Units that consist of combinations of the fundamental units are called derived units.
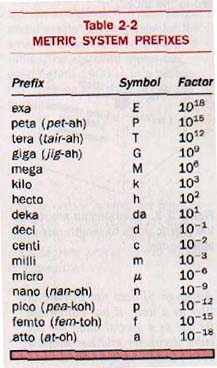
The prefixes used in the metric system, with their corresponding symbols and values, are shown in Table 2-2. The most commonly used of these prefixes are kilo(k), centi(c), and milli(m).
The use of units and symbols in this book is based on the latest specifications of the International Bureau of Weights and Measures.
2.2 The Meter The length of the meter was originally calculated to be one ten-millionth of the distance from the north pole to the equator along a line running through France and Spain. Until 1960, the standard for the meter was a metal bar kept in a vault at the International Bureau of Weights and Measures.
Toward the end of the nineteenth century, the American physicist Albert A. Michelson (1852-1931) developed a very precise measuring device called an interferometer, which uses light waves to measure length. With an interferometer, light of only one color is used in the measuring process. The light is produced by sending electricity through a gas that is under low pressure and then filtering the resulting glow so that only a single color emerges.
As a result of the work of Michelson and others with interferometers, the standard meter was redefined in terms of light waves. The gas that is used in the modern definition of the meter is a form of the element krypton called krypton-86. The specific wavelength of the glow of krypton-86 that is used to define the meter has an orange-red color. The definition adopted in 1960 is 1 meter (m) = 11650,763.73 wavelengths in a vacuum of the orange-red light of krypton-86
1 meter (m) = 1,650,763.73 wavelengths in a vacuum of the orange-red light of krypton-86.
The standard meter is accurate to about to two parts in one billion, or about one meter of uncertainty in measuring the distance from the earth to the moon. Even greater accuracy can be achieved with the help of laser beams, and as a result, scientists expect that a new definition of the standard meter will be adopted.
The metric units for the measurement of area and volume are derived from the meter. A rectangular floor 3 meters long and 2 meters wide has an area of 6 square meters. Similarly, a rectangular tank 4 meters long, 3 meters wide, and 2 meters deep has a volume of 24 cubic meters.
The liter (L) is a special name for a cubic decimeter (1OOO cm3). Since one milliliter (1 mL) is 1/1000th of a liter, 1 mL is equivalent to one cubic centimeter (1 cm3).
2.3 The Kilogram The SI standard of mass is the kilogram. It is defined as the mass of the standard kilogram kept by the International Bureau of Weights and Measures. Duplicates of the standard kilogram are kept in various countries around the world. These duplicates are occasionally checked against the standard kilogram.
The standard for the kilogram is the only one of the seven standards that still consists of a natural object representing a unit of measure. One reason why the standard kilogram is still a natural object is because masses can presently be compared with the standard with greater precision than is possible by means of other laboratory processes.
All other units of measure are presently determined through reproducible processes in the laboratory, such as using an interferometer in determining the standard meter. See Section 2.2.
It is useful to know that one milliliter of water has a mass of approximately one gram and that a five-cent United States coin has a mass of about five grams. A metric ton contains 1000 kg.
2.4 Force and Weight The SI unit of force is the newton (n). The newton is a derived unit that will be more fully described in Chapter 4. But it is important at this point to know the relationship between a newton and a kilogram, namely that a force of about 9.8 newtons is required to lift a mass of one kilogram in most places on the earth. (The exact number of newtons required at a specific location depends on the pull of gravity at that location, but 9.8 is a useful approximation.)
An apple weighs about 1 newton.
In most countries that use the metric system, the weights of people and objects are commonly described in kilograms. Since weight is a force, it should be described in newtons, and the use of kilograms for weights is not consistent with the rules of the International System of Units.
Perhaps a new definition of the kilogram will eventually be adopted to accommodate its widespread usage with weights. But in scientific literature at the present time, weights are correctly expressed in newtons.
2.5 The Second The unit of time is the second (s). Originally, the standard second was defined in terms of the earth's motion. This standard has been replaced by one that is based on atomic vibrations, which can be measured with an accuracy of one part in ten trillion.
The standard second is based on the rate of vibration of the cesium atom. The vibration is produced by radio waves, and it is not affected by such external influences as temperature and gravity. The rate of vibration can be tuned precisely to the radio waves that are producing it. The definition adopted in 1967 is
1 second (s) = 9,192,631,770 vibrations of cesium-133 atoms.
When the metric system was first proposed, an effort was made to redefine other time intervals as well. One proposal called for a month of three ten-day weeks. In this system, the day was divided into ten hours, the hour into 100 minutes, and each minute into 100 seconds.
However, decimal days were never officially adopted in any country. Thus, the numbers on our clocks and calendars remain conspicuous exceptions to the metric system.
MAKING AND RECORDING MEASUREMENTS
2.6 Accuracy The measurement of a physical quantity is always subject to some degree of uncertainty. There are several reasons for this: the limitations inherent in the construction of the measuring instrument or device, the conditions under which the measurement is made, and the different ways in which the person uses or reads the instrument. Consequently, in reporting the measurements made during a scientific experiment, it is necessary to indicate the degree of uncertainty so far as it is known.
One way to express the uncertainty of a measurement is in terms of accuracy. Accuracy refers to the closeness of a measurement to the accepted value for a specific physical quantify. It is expressed as either an absolute or a relative error. Absolute error is the actual difference between the measured value and the accepted value. The equation for absolute error is
Ea = |O-A|
where Ea is the absolute error, O is the observed (measured) value, and A is the accepted value. (The vertical lines mean the absolute value is used, regardless of sign.)
Relative error is expressed as a percentage and is often called the percentage error. It is calculated as follows:
Er = Ea/A x 100%
where Er is the relative error, Ea the absolute error, and A the accepted value.
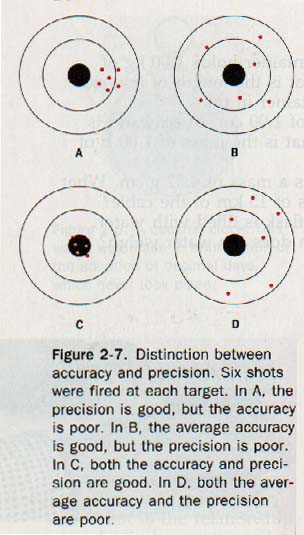
2.7 Precision In common usage accuracy and precision are often used synonymously. But in science it is important to make a distinction between them. You should learn to use the two terms correctly and consistently. Precision is the agreement among several measurements that have been made in the same way. It tells how reproducible the measurements are and is expressed in terms of deviation. Figure 2-7 should help you to distinguish between accuracy and precision as used in science.
As in the case of accuracy, deviations in precision can be given as absolute or relative (percentage). Absolute deviation is the difference between a single measured value and the average of several measurements made in the same way, or
Da = |O - M|
where Da is the absolute deviation, O is the observed or measured value, and M is the mean, or average, of several readings.
Relative deviation is the percentage average deviation of a set of measurements and is calculated as follows:
Dr = Da (average) / M x 100%
where Dr is the relative deviation, Da (average) is the average absolute deviation of a set of measurements, and M is the mean, or average, of the set of readings. The precision of your laboratory measurements will be governed by the instruments at your disposal.
In a measuring instrument the degree of precision obtainable is called the tolerance of the device. Any figure listed for the tolerance of an instrument indicates the limitations of the instrument.
The instrument maker assumes that the instrument is used properly and that human errors are held to a minimum. The usual platform balance, for example, has a tolerance of 0.1 gram. Some modern research instruments have tolerances of 0.00001 g or better!
2.8. Significant Figures Another way of indicating the precision of a measurement is by means of significant figures. Significant figures are those digits in a number that are known with certainty plus the first digit that is uncertain.
For example, if the length of a laboratory table was measured with a meter stick graduated in millimeters and found to be 1623.5 millimeters, the measurement has five significant figures. The 5 is the uncertain digit. It was an estimation of the value between two millimeter marks on the meter stick.
In working with significant figures, you can usually assume to know the last figure of a number, the uncertain figure, to within 1. For instance, when the value for a number is given as 3.14 you can assume that the true value lies between 3.13 and 3.15.
The following rules will help you to understand how significant figures are used in physics problems. Even these rules do not cover all cases. However, common sense usually shows how a specific case should be handled.
1. All nonzero figures are significant: 112.6oC has four significant figures.
2. All zeros between nonzero figures are significant: 108.005 m has six significant figures.
3. Zeros to the right of a nonzero figure, but to the left of an understood decimal point, are not significant unless specifically indicated to be significant.
In this book the rightmost such zero which is significant is indicated by a bar placed above it: 109,000 km contains three significant figures; 109,000 km contains five significant figures.
4. All zeros to the right of a decimal point but to the left of a nonzero figure are not significant: 0.000647 kg has three significant figures. The single zero placed to the left of the decimal point in such an expression serves to call attention to the decimal point and is never significant.
5. All zeros to the right of a decimal point and following a nonzero figure are significant: both 0.07080 cm and 20.00 cm have four significant figures.
6. Rule for addition and subtraction. Remember that the rightmost significant figure in a measurement is uncertain. The rightmost significant figure in a sum or difference will be determined by the leftmost place at which an uncertain figure occurs in any of the measurements being added or subtracted.
The following example of addition illustrates this rule. Since the answer should have only one uncertain figure (the rightmost one), it should be recorded as 326.0 cm.
7. Rule for multiplication and division. Remember that when an uncertain figure is multiplied or divided by a number, the answer is likewise uncertain. Therefore the product or quotient should not have more significant figures than the least precise factor. The following example illustrates the rule for multiplication.
3.54 cm x 4.8 cm x 0.5421 cm = 9.2113632 cm3
Consequently, the answer should be recorded as 9.2 cm3
8. Rule for rounding. If the first figure to be dropped in rounding off is 4 or less, the preceding figure is not changed; if it is 6 or more, the preceding figure is raised by 1. If the figures to be dropped in rounding off are a 5 followed by figures other than zeros, the preceding figure is raised by 1. If the figure to be dropped in rounding off is a 5 followed by zeros (or if the figure is exactly 5), the preceding figure is not changed if it is even; but if it is odd, it is raised by 1.
2.9 Scientific Notation Scientists frequently deal with very large and very small numbers. The velocity of light in air is about 300,000,000 meters per second. The mass of the earth is about 6,000,000,000,000,000,000,000,000 kilograms. The rest mass of an electron is 0.000,000,000,000, 000,000,000,000,000,000,910,953,4 kilogram.
These numbers are inconvenient to write and difficult to read. Through the use of the mathematical rules of exponents, however, it is possible to express these numbers in a much simpler way. Using powers of ten in writing a number is called scientific notation. Such numbers have the form
M x lOn
where M is a number having a single nonzero figure to the left of the decimal point and n is a positive or negative exponent. To write a number in scientific notation:
1. Determine M by shifting the decimal point in the original number to the left or to the right until only one nonzero digit is to the left of it. M should contain only the significant figures of the original number.
2. Determine n by counting the number of places the decimal point has been shifted; if it has been moved to the left, n is positive; if to the right, n is negative. For example we see that the velocity of light can be written as 3 x 10⁸ m/s, the mass of the earth as 6 x 1024 kg and the mass of an electron is 9.109534 x 10⁻³¹ kg.
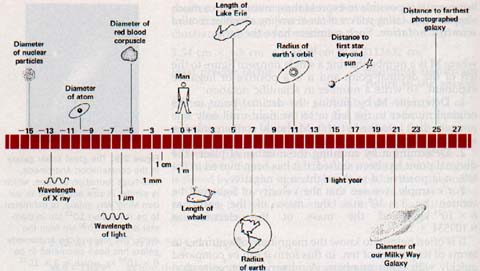
It is often helpful to know the magnitude of a number in terms of its powers of ten. In this form it can be compared quickly with other numbers. A numerical approximation to the nearest power of ten of a number is called its order of magnitude.
The order of magnitude of the velocity of light in m/s is 108. The order of magnitude of the mass of the earth in kg is 1025 since its mass is nearer to 1023 kg than it is to 1024 kg.
Similarly, the order of magnitude of the mass of the electron in kg is 10-30.
Orders of magnitude of length of a number of objects in the universe are shown in Figure 2-10 on page 30.
SOLVING PROBLEMS
2.10 Data, Equations, and Graphs Scientists usually use the term "data" to refer to the numbers, units, and other information recorded when measurements are made. Much of your homework in physics will involve solving problems in which the necessary data are already provided for you. The problems at the ends of the chapters in this book are like that. Your objective is to use the data properly in order to find the quantity required.
The first step in solving a problem of this kind is to list carefully all the data provided.
Be sure to include the correct symbol and unit for each physical quantity. If the symbol is not given in the problem, look it up inside the front cover of this book or in Appendix B, Table 4.
Record these symbols correctly at the start. As you continue working the problem, be sure you use only these symbols. Also check to make sure that you have copied the right number of significant figures in each case, above the scale are powers of ten.
In the laboratory most of the data needed must be obtained by direct measurement. In some experiments you will be told what to measure, what instruments to use, and even how many significant figures to use. But in other experiments you must make these decisions for yourself.
In recording and interpreting data in physics, you will use mathematical skills that you have acquired in previous courses. The Mathematics Refresher, following Chapter 25, contains a summary of information and skills from arithmetic, elementary algebra, plane geometry, and trigonometry that is useful in the study of physics.
At this time you should review the information contained there and try some of the examples. Study carefully any procedure with which you are not familiar.
The purpose of a scientific experiment is to discover relationships that may exist among the quantities measured. The experimenter controls the conditions of the experiment in order to obtain the most accurate measurements. Uncontrolled conditions might make the measurements so confusing that relationships would not be discovered.
As an example, suppose you wished to discover any relationships that might exist between the mass of a homogeneous substance (the same throughout) and its volume. You measure the volumes of several samples of different substances and determine the mass of each.
Since temperature affects the volume of most substances, you control this condition by taking all of your measurements at the same temperature, such as 20 oC.
As the volume of each substance increases, the mass also increases. But this statement is very general. You are looking for a specific equation. Sometimes, plotting the data on a graph reveals the equation that expresses the relationship among the measurements.
As you see, Figure 2-11 is a graph of the data. The zero point is the origin of the graph. The horizontal line through the origin is called the X axis. On it are measured distances from the origin, or abscissas, equivalent to the various volumes. For convenience, use one small interval to represent 10 cm3 The vertical line through the origin is called the Y axis. On it are measured distances from the origin or ordinates, equivalent to the various masses. Use one small interval to represent 10 g.

When the data for aluminum, water, and maple wood Figure 2-11. Graph of three direct are plotted on the graph, the data for each substance can be connected by a straight line. The mathematical relationships between the mass and the volume is called a direct proportion.
Plotting data that directly proportional always results in the graph of a straight line.
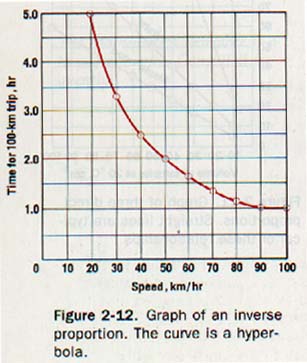
To illustrate another kind of graph, let us plot the data given in Table 2-5, which shows the time required to make a trip of 100 kilometers at various speeds. A line drawn through the plotted points, as shown in Figure 2-12, is a hyperbola. Furthermore, the product of the speed and time is constant. Two quantities whose product is a constant are in inverse proportion.
A proportion can be changed into an equation by introducing a constant. In the volume-mass relationship the constant for each substance can be calculated. (For example, if each measurement in the volume column is multiplied by 2.7, the measured mass of aluminum results.) The equation for this relationship is m = DV where D is a constant. Solving the equation for D,
D = m/V
This is the equation for mass density that was given in Section 1.9. With this equation you can find any one of the three physical quantities (D, m, or V) provided the measurements for the other two are given. The mass densities of most substances range from O.l g/cm3 to 1O g/cm3. Mass densities are usually given in g/cm3 instead of kg/m3 to avoid cumbersome numbers. For example, 1g/cm3 becomes 100 kg/m3.
A carefully drawn graph provides you with another helpful tool. You can use it to estimate values between the plotted points (interpolation) and beyond the measurements made in the experirrient (extrapolation).
Estimation of answers is not limited to interpolation and extrapolation. When you solve a problem in physics, you should make an intelligent guess about the reasonableness of your answer. Such a "check for reasonableness" will frequently disclose major errors in arithmetic or algebra.
2.12 Vectors Physical quantities such as length, area, volume, mass, density, and time can be expressed in terms of magnitude alone as single numbers with suitable units. For instance, the length of a table can be completely described as 1.5 m. The mass of a steel block is completely described as 54 kg.
Quantities, such as these, that can be expressed completely by single numbers with appropriate units are called scalar quantities, or simply, scalars. ("Scalar" is derived from the Latin word scala, which means "ladder" or "steps" and implies magnitude.)
Additional examples of scalars in physics are energy and temperature. Other physical quantities, such as force, velocity, acceleration, electric field strength, and magnetic induction, cannot be completely described in terms of magnitude alone. In addition to magnitude these quantities always have a specific direction.
Quantities that require magnitude and direction for their complete description, and whose behavior can be described by certain mathematical rules, are called vector quantities They can be represent by vectors. ("Vector" is derived from a Latin word meaning "carrier," which implies displacement.)
The ability to work with vectors is an important mathematical skill that is necessary in solving problems that deal with vector quantities.
A vector is usually shown as an arrow. The length of the arrow represents the magnitude of the vector, while the orientation of the arrow shows direction.
WARNING! Do NOT forget to put arrow heads on your vectors!!
North is usually toward the top of the page, east is toward the right, south is toward the bottom, and west is toward the left. When two or more vectors act at the same point, it is possible to find a single vector that produces the same effect as the combination of separate vectors.
In such a calculation, each separate vector is called a component and the single vector that produces the same result as the combined components is called the resultant.
The following examples show basic rules in solving vector problems. A vector of 8.0 units and a vector of 3.0 units are shown, both directed northward. (These vectors might represent velocities, or forces, or any other vector quantities. But in this introductory treatment of vectors, we shall simply designate them as "units.")
When two or more vectors act at the same point and in the same direction, the magnitude of the resultant is the algebraic sum of the magnitudes of the components.
The resultant has a magnitude of 11.0 units. (The vectors in the figure should be considered as acting at the same point, even though they are shown side by side for the sake of clarity.) The resultant has the same direction as the components.
This time the 8.0-unit vector acts northward as before, but the 3.0 unit vector acts southward. When these two vectors act at the same point, the magnitude of the resultant is the algebraic difference of the component magnitudes, or 5.0 units.
Another way of saying this is that the magnitude of the resultant is the algebraic sum of the component magnitudes, with the 3.0-unit vector considered as negative, since it is acting in the opposite direction.
The resultant has the direction of the larger component, or northward. A third case is shown in Figure 2-15. The 8.0-unit vector is again acting northward, but the 3.0-unit vector is now directed eastward.
In this case, the components do not act along a straight line, and the resultant cannot be found by simple addition or subtraction. Instead, the parallelogram method is used. (Experiments confirm that the parallelogram method accurately represents the behavior of vectors that do not act along a straight line.)

To find the resultant, we construct the parallelogram ONRE. The diagonal of this parallelogram OR, is the resultant.
The magnitude and direction of OR can be found in either of two ways.
If the vector diagram is drawn accurately to scale, OR can be measured directly with a ruler and a protractor.
This is called the graphic solution. Of course, in using a ruler it is important to use the same scale in measuring each vector. The ruler and protractor should be read to the limits of their precision and the rules of significant figures should be followed in rounding the answer.
A second way of finding OR is to use trigonometry. To understand this method, you should review the Mathematics Refresher, 12. Triangles (in the back of the book).
The use of the Pythagorean theorem is not recommended for finding the resultant, since it gives only the magnitude and not the direction. The direction of a vector can be calculated only by the use of trigonometric ratios. This method of finding resultants is called the trigonometric solution.
Be sure to follow the rules of significant figures. By either the graphic or trigonometric method, OR in Figure 2-15 has a magnitude of 8.6 units and a direction of 21o east of north.
The direction could also be designated as 69o north of east, but in the answers to the vector problems in this book, the smaller of the two complementary angles will always be given.
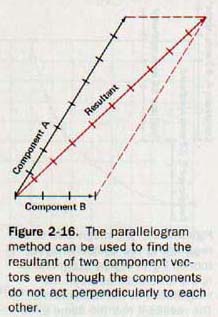
The parallelogram method can also be used when vectors act at angles other than right angles, as in Figure 2-16. The gaphic solution is similar to the one in the previous example, but the trigonometric solution is lengthier, since it involves the law of cosines and law of sines. Examples and solutions of this kind are given in Chapter 3.
Vectors may also be combined by placing them head to tail, as shown in Figure 2-17. This method is especially helpful in finding the resultant of three or more vectors that act at the same point. If the parallelogram method were used in such a case, it would first be necessary to find the resultant of any two of the vectors, then use this resultant with a third vector to find a second resultant, and continue in this way until all the component vectors have been applied. The final resultant would then be the required answer.
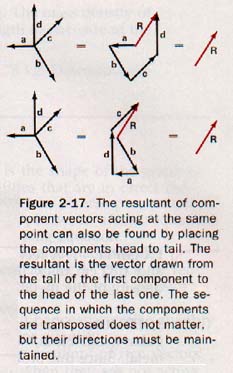
The procedure shown in Figure 2-17 is really a shortcut for the parallelogram method. In using this method, it does not matter in what sequence the arrows are drawn, as long as the direction of each arrow is maintained when it is transposed. After all the components have been transposed, the resultant is the arrow that is made by starting at the tail of the first component and drawing a straight line to the head of the last component.
2.12 Rules of Problem Solving The problems in this text range from those that are quite simple and involve only a single computation to those that require several derivations and a number of separate mathematical steps.
In general, problems of the first type will be found in Group A at the ends of the chapters. Examples of this type are given within the chapters themselves. Problems of greater difficulty involving several steps are included in Group B, and examples of these are also in the chapters.
The method used to solve physics problems consists of a number of logical steps. These steps are described below and they are illustrated in examples throughout the book.
1. Read the problem carefully and make sure that you know what is being asked and that you understand all the terms and symbols that are used in the problem. Write down all given data.
2. Write down the symbols for the physical quantity or quantities called for in the problem, together with the appropriate unit symbols.
3. Write down the equation relating the known and unknown quantities of the problem. This is called the basic equation. In this step you will have to draw upon your understanding of the physical principles involved in the problem. It is helpful to draw a sketch of the problem and to label it with the given data.
4. Solve the basic equation for the unknown quantity in the problem, expressing this quantity in terms of those given in the problem. This is called the working equation.
5. Substitute the given data into the working equation. Be sure to use the proper units and carefully check the significant figures in this step.
6. Perform the indicated mathematical operations with the units alone to make sure that the answer will be in the units called for in the problem. This process is called dimensional analysis.
7. Perform the indicated numerical operations. Be sure to observe the rules of significant figures.
8. Check the answer for reasonableness. For example, if your answer shows a car moving at a speed of 1000 km/hr, you made a mistake in one of the previous steps. 9. Review the entire solution.
Some problems, especially those that deal with vectors, do not involve all of these steps and may require other skills instead. In every case, it is important to understand the basic principles of the problem. This is much more meaningful than merely "getting the right answer."
SUMMARY
The metric system of measurement is a decimal system well suited to scientific purposes. The United States is in the process of converting to the metric system. In 1996, Congress declared the Metric System the Preferred System. Physical quantities are aspects of the universe. They are measured in units. All units of measure are derived from seven fundamental units that are used to measure length, mass, time, electric charge, temperature, amount of substance, and luminous intensity.
Many other units are derived from the fundamental units. The names and symbols for physical quantities and units have been standardized in the International System of Units (abbreviated SI).
The SI standard unit of length is the meter. It is based on a specific wavelength of the light emitted by krypton-86 atoms. The standard unit of mass is the kilogram, which is based on the mass of a cylinder kept in France. The unit of force is the newton, which is a derived unit. The unit of time is the second, which is based on the vibrations of cesium-133 atoms.
All measurements are uncertain to some degree. The closeness of a measurement to an accepted value is called accuracy. It is expressed as absolute error or relative (percentage) error. Precision is the agreement among measurements that have been made in the same way. Precision is expressed as absolute deviation, relative deviation, or tolerance.
It may also be shown by significant figures, which are all the figures of a measurement that are known with certainty plus the first figure that is uncertain. Specific rules govern operations with significant figures.
Scientific notation is a convenient way of writing very large and very small numbers. Such numbers have the form M x 10n in which M is a number with one nonzero figure to the left of the decimal point and n is a positive or negative exponent. The order of magnitude of a number is the approximation of the number to the nearest power of ten.
Data is the term used for the numbers, units, and other information obtained in experiments. Tables, graphs, and equations are used to express the relationships among data. A straight-line graph illustrates a direct proportion. A hyperbola is indicative of an inverse proportion, in which the product of two quantities is a constant.
A scalar is a quantity that needs only a number with appropriate units to describe it. A quantity that requires magnitude and direction for its description is a vector quantity. It is usually represented by an arrow in which the length represents magnitude and the orientation of the arrow specifies direction. Vectors in the same or opposite direction can be combined by simple addition or subtraction. The resultant of vectors at other angles is found by the parallelogram or the head-to-tail method.
The solving of a physics problem involves a number of logical steps. Among these are the use of a basic equation, which relates the known and unknown quantities of the problem, and a working equation, which expresses the unknown quantity in terms of the known ones. Another important step is dimensional analysis, in which the mathematical operations are performed with only the units. The Hup Two Three Four.
VOCABULARY
absolute deviation, absolute error, accuracy, basic equation, component derived unit, dimensional analysis, direct proportion, fundamental unit, inverse proportion, kilogram, length, liter, meter, metric system, newton, order of magnitude, parallelogram method, physical quantity, precision, relative deviation, relative error, scalar quantity, scientific notation, second, significant figure, standard, vector quantity, working equation
Ah Yaz Indeed!
 Assignment Sheet for this Research Text Only.
 Go to Textbook Assignments for Portfolio:
.................................First Semester
.................................Second Semester